


A double event organised by Tech-Spark in collaboration with the MMDPUG: Markus Ehrenmüller-Jensen delivered a virtual session on “Creating Visualizations using R” and Andrew Sammut an in-person session titled “BI on Azure Cloud”.
The schedule was as follows:
18.00 – 18.30 Registration
18.30 – 19.30 Session 1 – Create Stunning Visualizations with The Help of R by special guest Markus Ehrenmüller-Jensen (remotely)
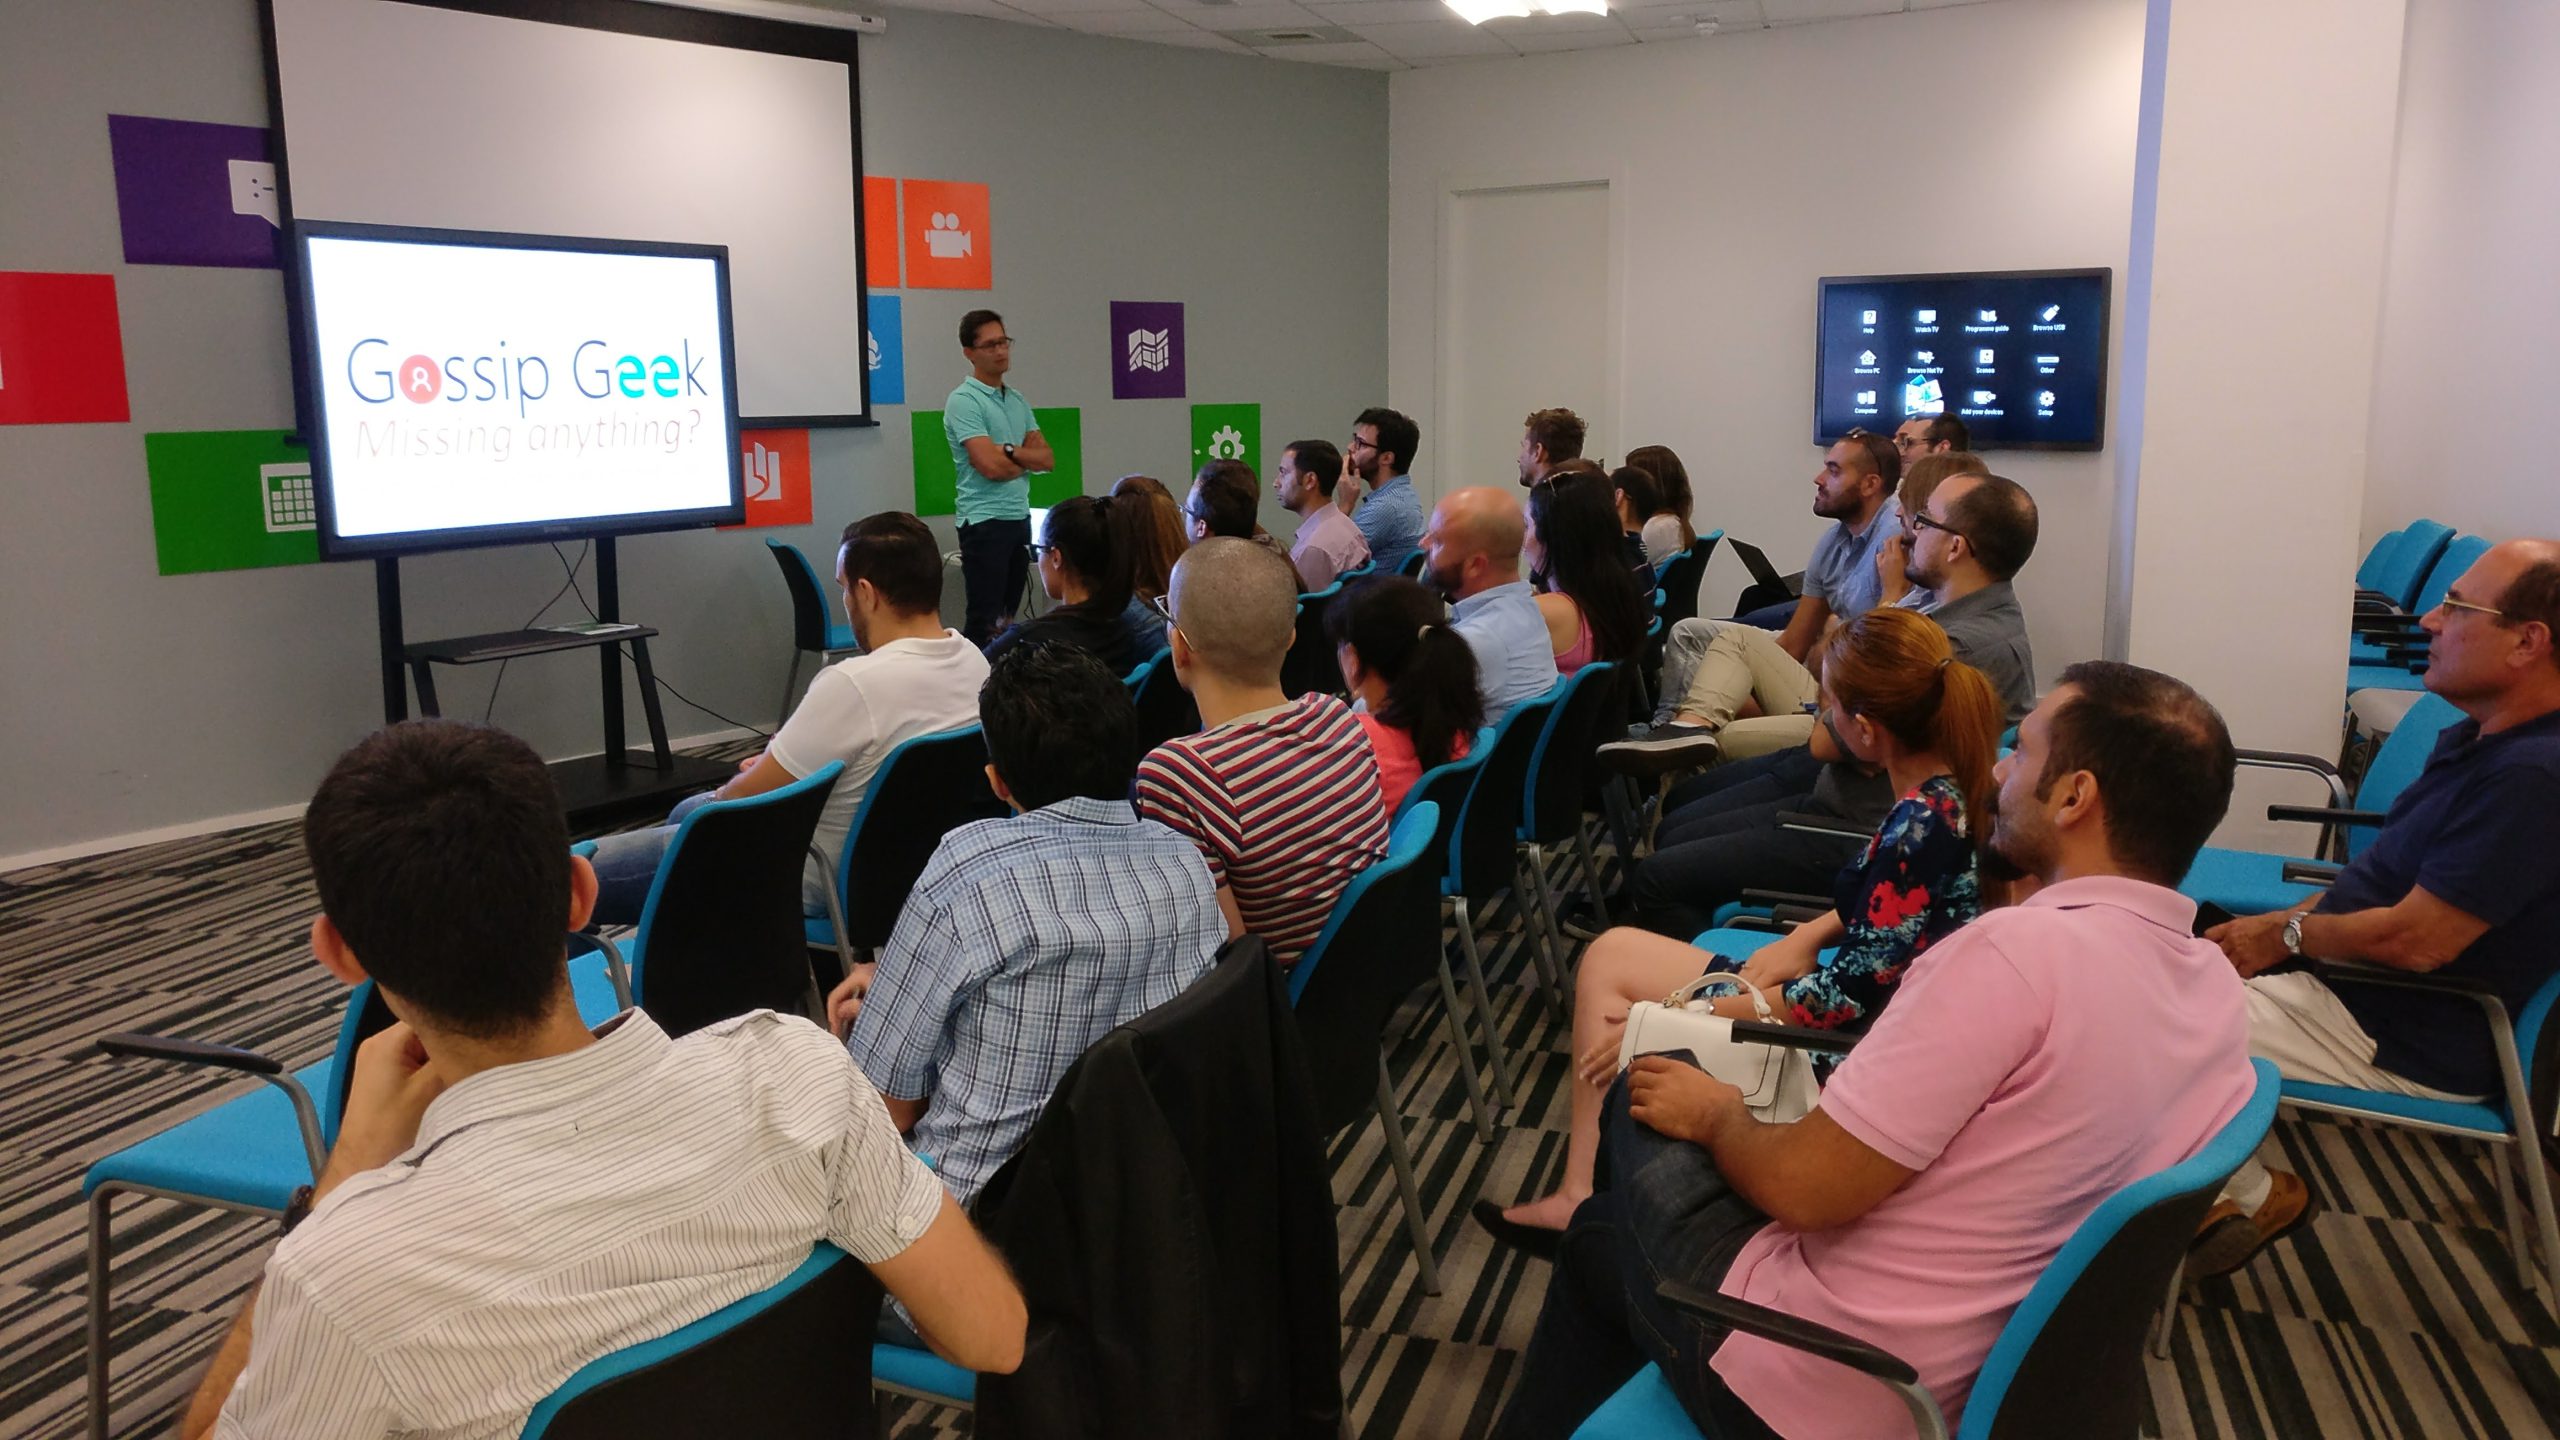
19.30 – 19.45 “Gossip Geek – Geek’s news”
19:45 – 20:00 Break, networking
20:00 – 21:00 Session 2 – Business Intelligence on Azure Cloud by Andrew Sammut
Session 1 – Create Stunning Visualizations with The Help of R
R is the first choice for data scientists for a good reason: besides accessing and transforming data and applying statistical methods and models to it, it has a wide variety of possibilities to visualize data. As visual perception of data is the key to understanding data, this capability is crucial. This session will give you a broad overview over available packages and diagram types you can build with them on the one hand, and a deep dive into common visualizations and their possibilities on the other hand. Impress yourself and your peers with stunning visualizations which will give you insights into data you could not achieve with other tools of Microsoft’s BI stack.
Download Data Visualizations using R presentation and solution
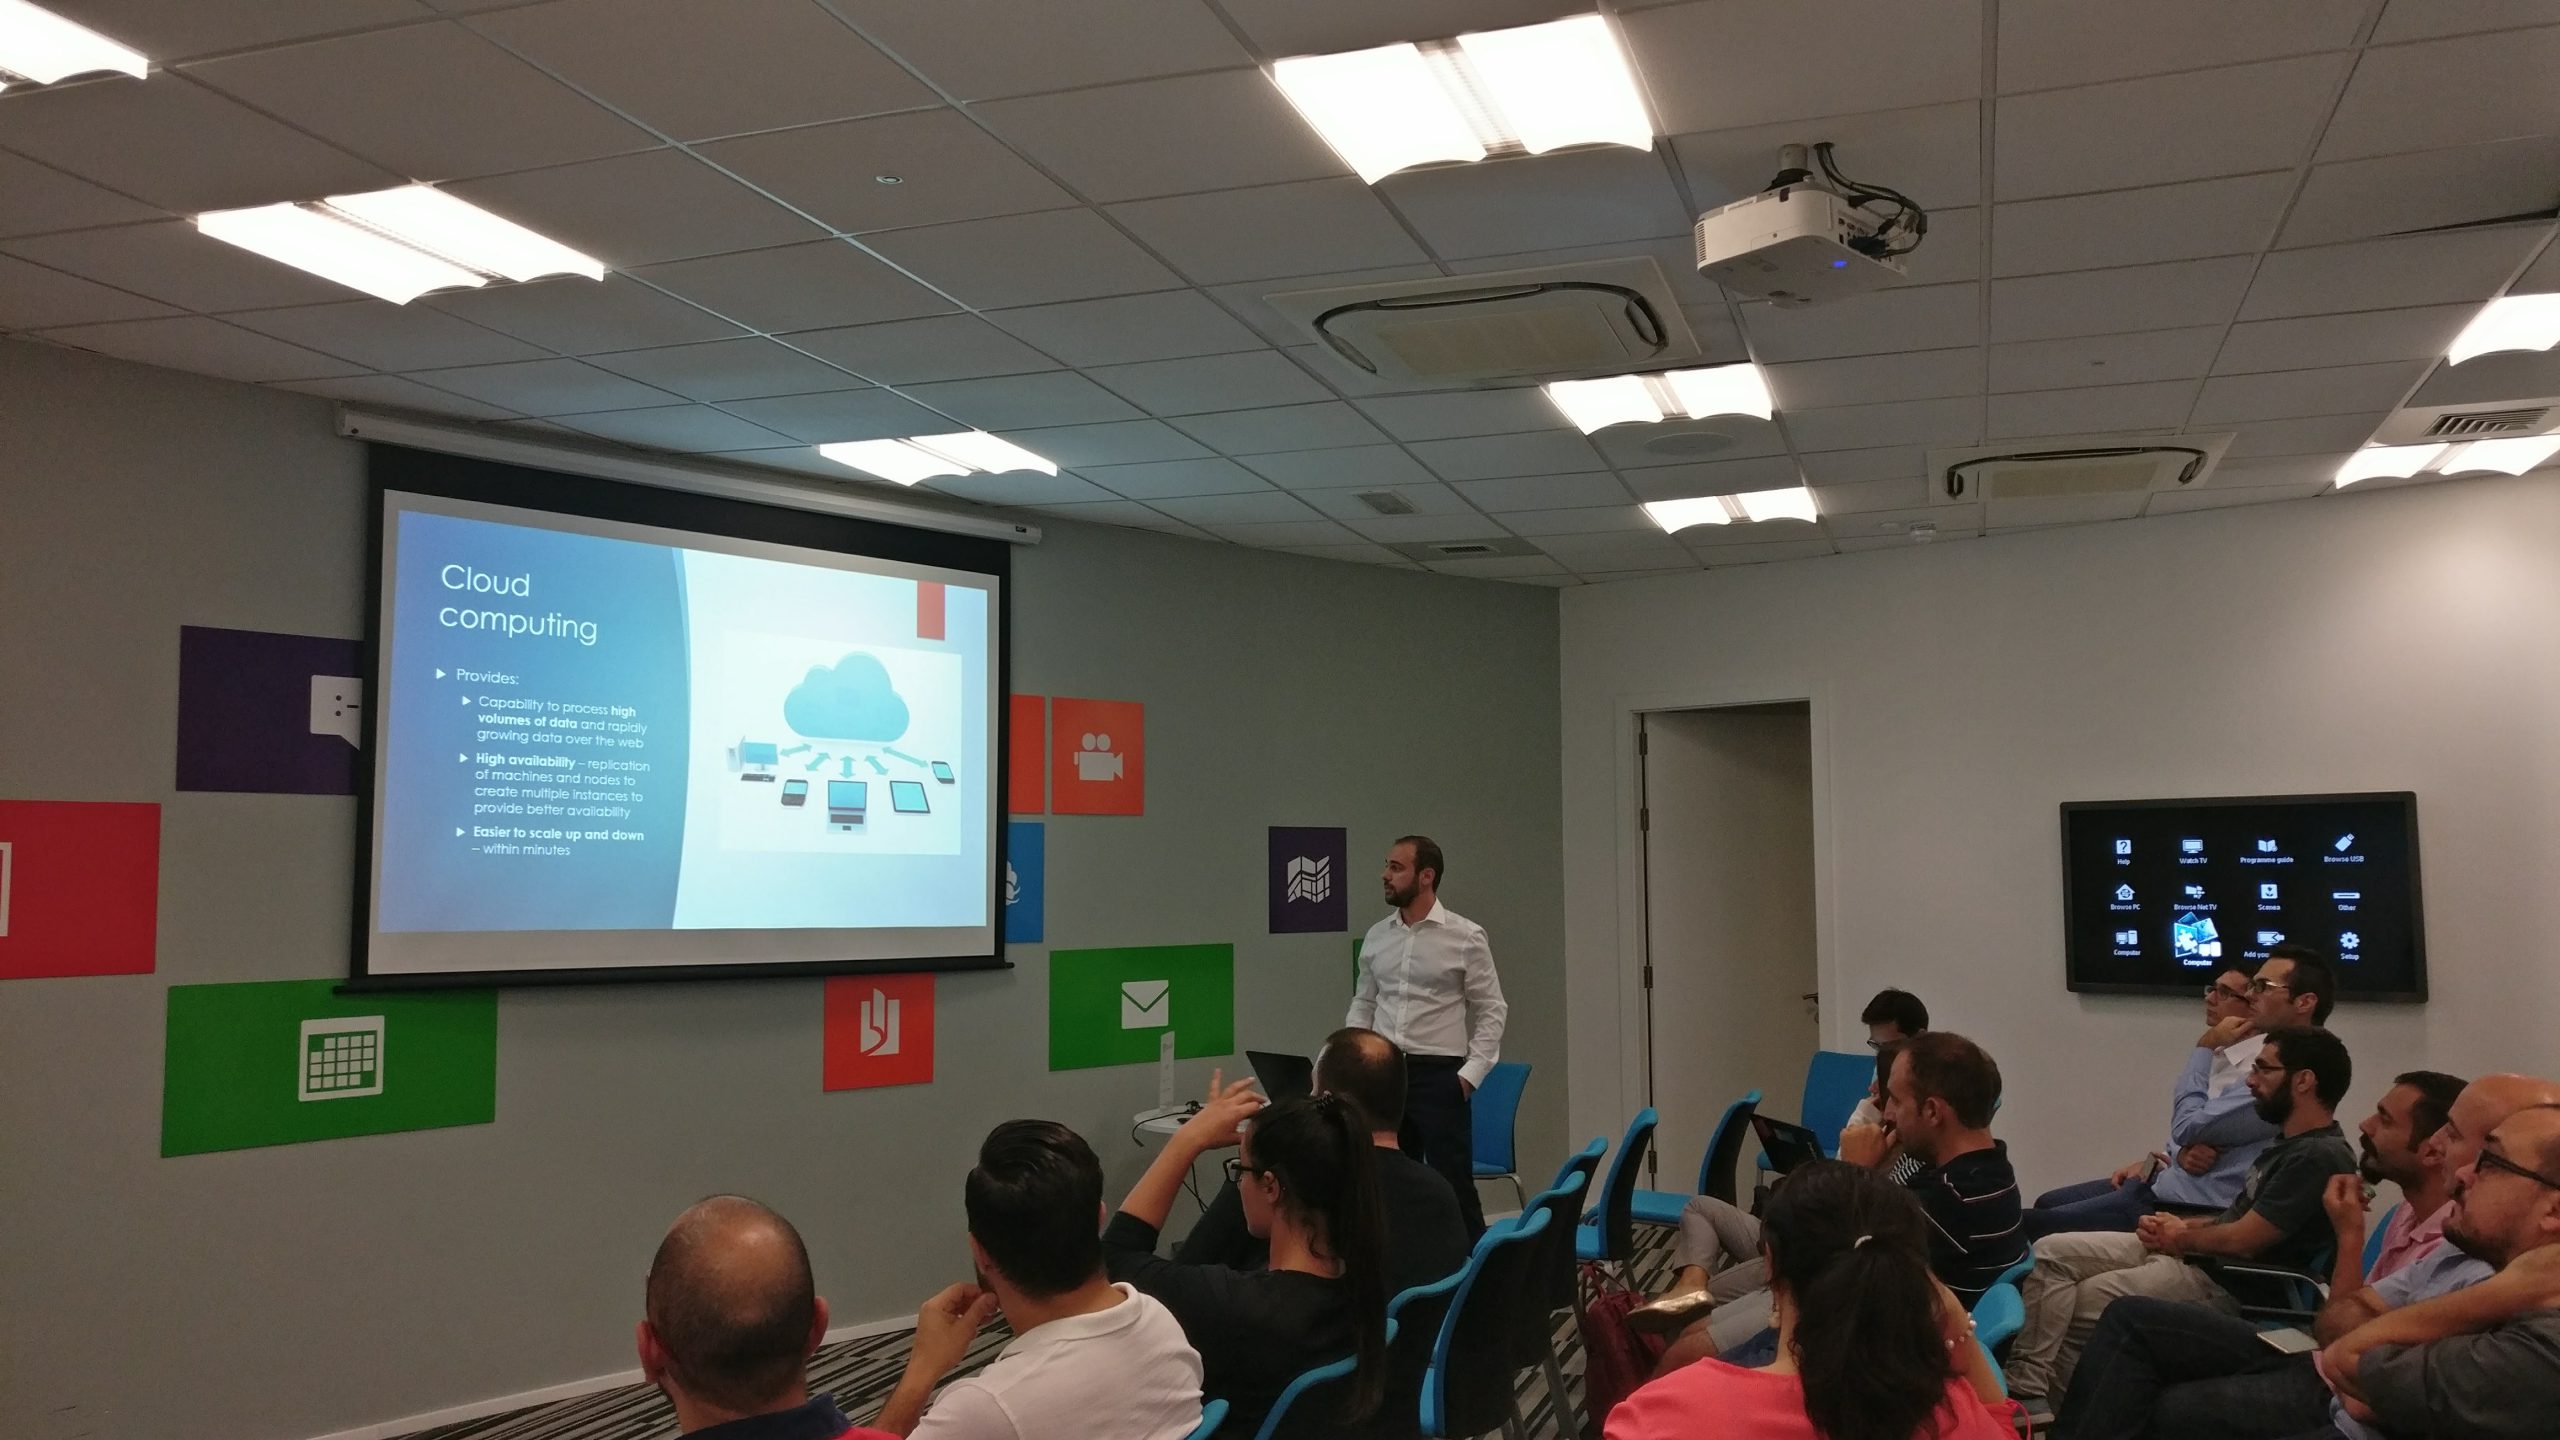
Session 2 – Business Intelligence on Azure Cloud
Enterprise Business Intelligence (BI) solutions today are analyzing growing amounts of data. We are in a world were data can be consumed from numerous channels – news feeds, APIs, live streams – leading to high volumes of data. In conventional BI solutions this has been managed through expensive hardware & software upgrades – where in demands of a growing business can make this economically unfavourable.
This session demonstrates how one could leverage the power of the cloud to analyse data in a complete Azure hosted BI system. The areas which will be covered throughout the talk include Azure DB, Azure Analysis Services, the Data Analytics Expressions (DAX) and PowerBI. This session will also create how PowerBI can be used as a live connection with a tabular model hosted on azure to quickly analyse data.
Download Azure Business Intelligence presentation
Event sponsored by Microsoft.